Calculate your sample size using the Minimum Detectable Difference (MDD)

Estimate your project’s ideal sample size using the MDD approach with Seqana’s MDD sample size calculator. You can experiment with various scenarios below to find the ideal sample size for your project specifications.

What is the Minimum Detectable Difference (MDD)?

Under the Minimum Detectable Difference (MDD) approach, project developers determine the number of samples where you can claim a positive level of SOC sequestration as statistically significant.

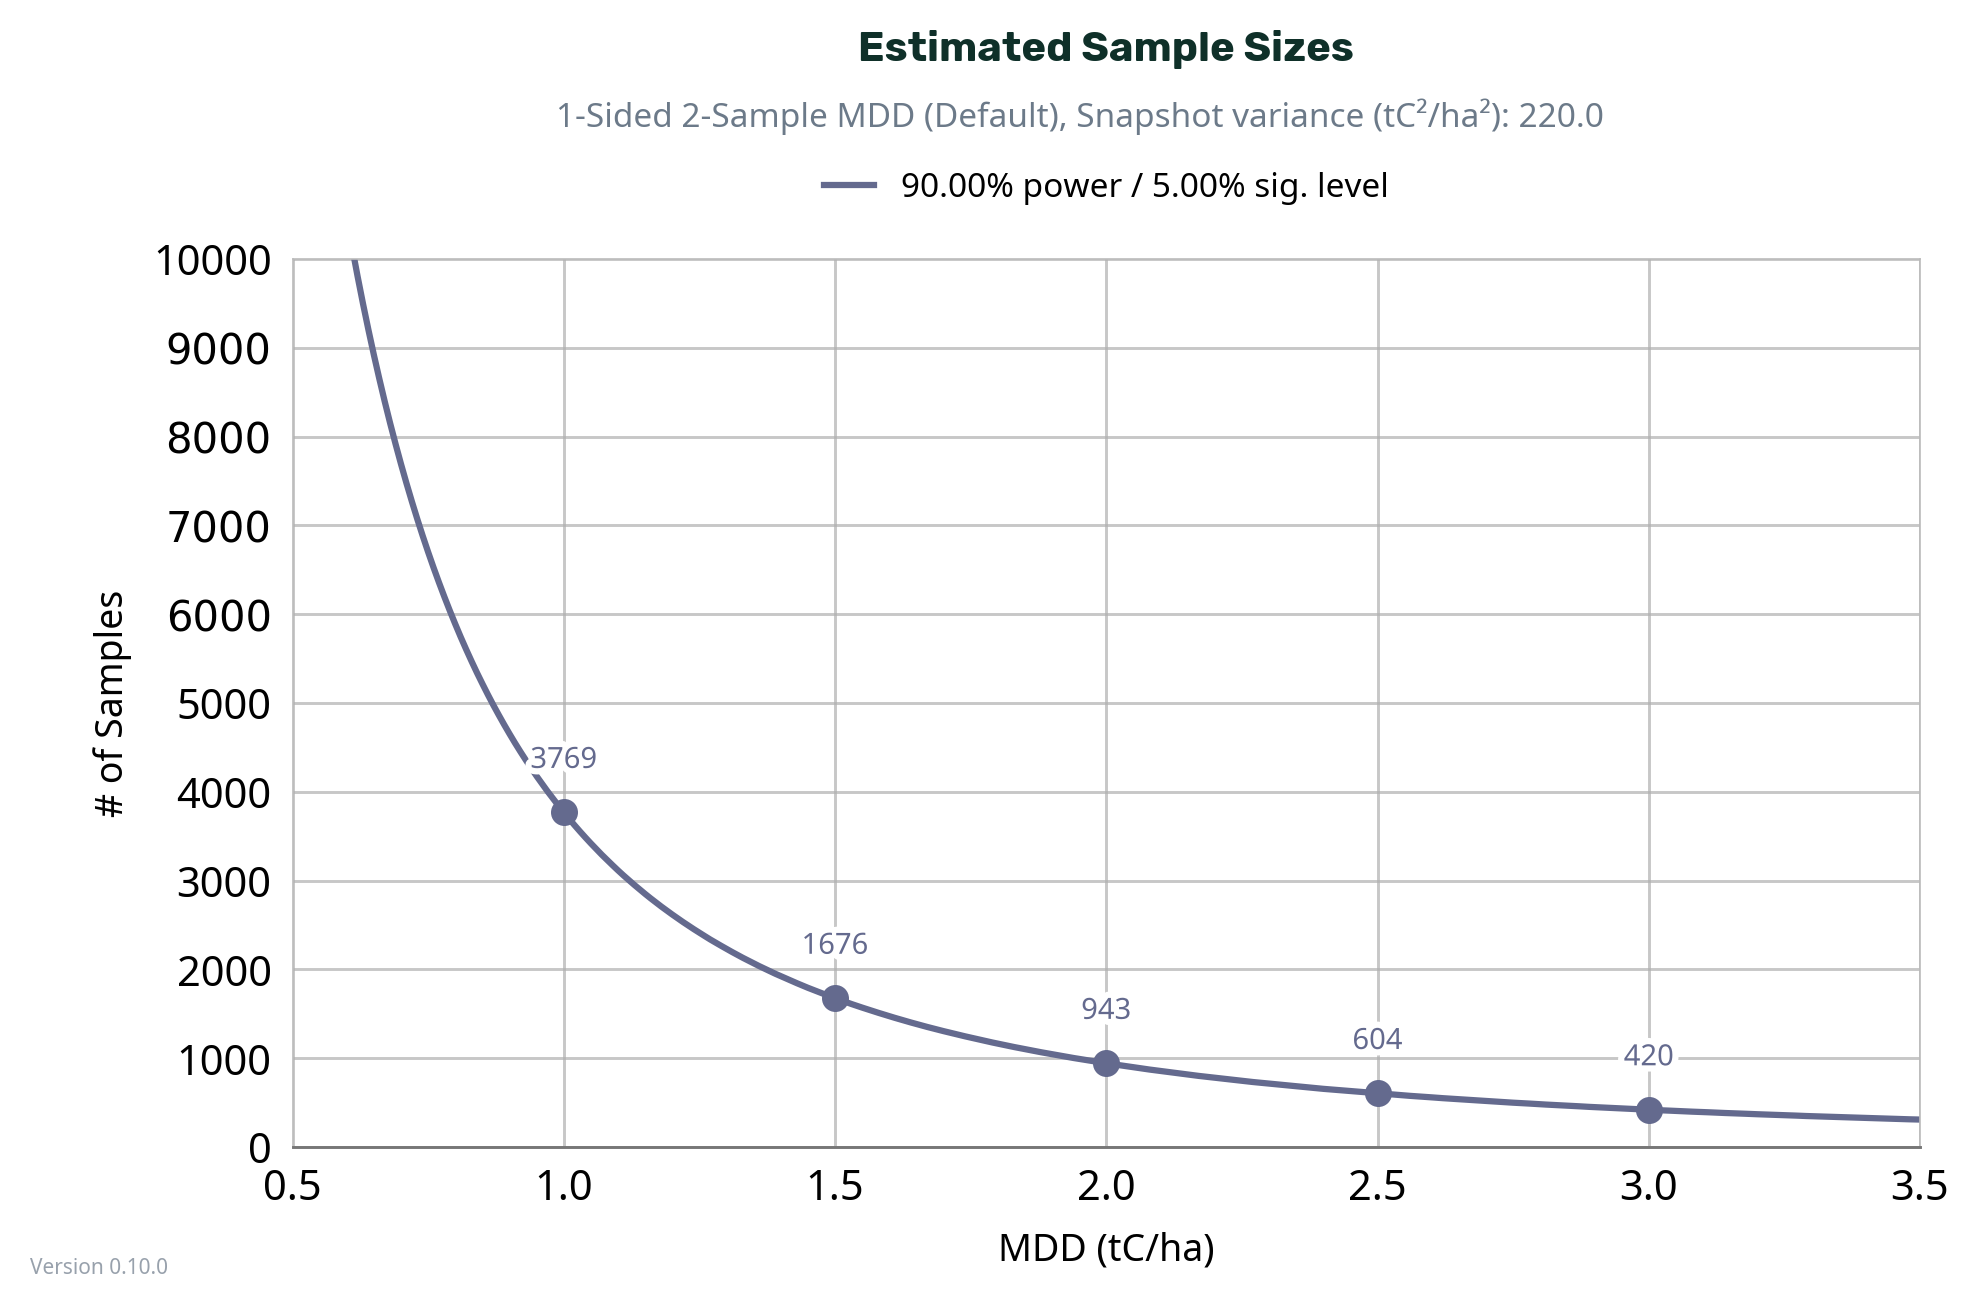
The MDD is the smallest amount of sequestration that must occur in order to detect a level of sequestration as statistically significant.

With higher MDDs, project developers can take fewer samples; however, you run the risk of not reaching the minimum level of sequestration required to claim sequestration.

To understand more about how sample size impacts your project economics, explore our EONS Calculator, which determines your Economically Optimum Number of Samples (EONS).

Try out the MDD Sample Size Calculator:

Need some guidance on where to start?

Calculating the sample size using the MDD approach is common across many methodologies. Seqana can help you break down the methodological requirements, set the right MDD for your use case, and understand how it impacts your final project claims.

FAQs

We answer some of the most common questions to calculating the sample size using the MDD Approach and its implications for your project criteria.

What is the Minimum Detectable Difference (MDD)?

In SOC MRV applications using one-sided t-tests, the Minimum Detectable Difference (MDD) is the smallest increase in the mean SOC stock across the project area that a given sampling design* can detect as a statistically significant effect of sequestering more than 0 tC/ha. The MDD only sets the binary decision threshold for whether a measured change is statistically significant positive (i.e. >0tC/ha) and does not provide any statistical evidence about the actual magnitude of that change. 

The MDD is determined by the variance of SOC measurements, the sample size, and the test design. If the actual change is smaller than the MDD, the study is unlikely to detect it reliably. Therefore, when planning SOC MRV, the MDD should be chosen so that it is smaller than or equal to the expected SOC changes over the remeasurement interval; otherwise, sample sizes must be increased. Setting the MDD too high risks underestimating required sampling intensity.

For example, if your expected change is 0.3 tC/ha/year and you resample after 5 years, you should select an MDD of ≤ 1.5tC/ha (=0.3tC/ha/yr * 5 years) as the actual change will have to be at least 1.5tC/ha to declare a positive sequestration as statistically significant. A smaller MDD allows declaring a positive sequestration as statistically significant at smaller SOC sequestration rates, but requires more samples.

* The sampling design here refers to the combination of 1) Variance of the target variable; 2) Sample size 3) Significance level, 4) Power 

How is the MDD used to calculate sample sizes?

Sample size calculations using an MDD are based on the statistical concept of hypothesis testing. In technical terms, we begin with a null hypothesis, which in the use-case of SOC MRV can be defined as no change or a negative change (i.e. SOC stock change ≤ 0 tC/ha). The 1-sided MDD test requires a minimum sample size to be able to reject that null hypothesis. For a 1-sided t-test, in addition to the MDD and the variance of the target variable, the sample size depends on:

  • Significance level (α): the risk of erroneously claiming positive sequestration (false positive).
  • Power (1 – β): the probability of detecting an actual positive change (true-positive).

If the actual change in your target variable is greater than the MDD, your sampling design has a high probability (as defined by power) of detecting a positive (>0) sequestration.

What does the 1-sided MDD t-test help us answer?

An MDD t-test help answer the question:

"How many samples are needed to claim a positive SOC sequestration as statistically significant at a set MDD (≤ expected sequestration), power and significance.” 

In SOC projects, using an MDD-based approach to estimate sample size allows you to understand the risk your project faces in its ability to detect change.

An example conclusion could be: 

“With 157 samples and a 5% significance level if: 

  • Soil organic carbon (SOC) stock actually increases by 3 tC/ha,
  • And the MDD is set at 3 tC/ha, 

→ then the test would successfully flag a positive (>0 tC/ha) change as statistically significant in 90% of the cases".

It is important to note that the 1-sided MDD test used in SOC MRV contexts does not answer the magnitude of the change, but whether a positive change is statistically significant, that is, whether the test can reject the null hypothesis of ≤ 0 tC/ha increase.

What is the difference between a 1-sided and 2-sided test, and why does Seqana use 1-sided tests in SOC projects?

The main difference is that a 2-sided test looks for any difference (higher or lower) and thus requires more samples, while a 1-sided test looks for a difference in one specific direction and thus requires fewer samples.

  • 2-sided test: The null hypothesis is that the two populations are equal, and the alternative is that they differ in either direction. Because it tests both possibilities, it requires a larger sample size for the same minimum detectable difference (MDD) and power.

  • 1-sided test: The null hypothesis assumes SOC stock did not increase, and the alternative hypothesis is that SOC stock increased. Since it focuses on one side of the distribution, it requires fewer samples for the same MDD.

Seqana recommends 1-sided t-tests in SOC projects because the only meaningful outcome is an increase in soil organic carbon. We are not interested in testing whether SOC stocks have decreased or if SOC stocks have remained the same, only in detecting and confirming sequestration gains. An added benefit is that 1-sided t-tests require fewer samples than 2-sided t-tests.

What is the difference between paired sampling and independent sampling and which is appropriate for my project?

Paired sampling compares two measurements from the same locations over time (e.g., SOC in the same geolocation at t₀ and t₁). It requires:

  • Plot-level continuity (e.g., GPS-referenced sample sites),

  • The ability to calculate change within each location,

  • An estimate of the variance of change to calculate sample size requirements.

However, in SOC projects, paired sampling is often impractical because:

  • Soil sampling is destructive, so it is impossible to re-sample the exact same soil,

  • Re-sampling the exact same location is practically unfeasible. Due to GPS and operational limitations, resampling tends to happen within a 10m radius of the initial sample. Within a 10m radius, the spatial SOC stock variability tends to be higher than the expected change, which leads to mixing up spatial variability with actual change (see Myth 3 in our Variance blogpost here).

  • An estimate of the variance of change is required to calculate the sample size. There is no scientifically robust way to estimate the variance of change ex-ante. 

Independent sampling compares two separately sampled groups, which allows you to:

  • Sample SOC at t₀ vs. SOC at t₁, independently. In other words, no need to resample the exact same location

  • Use the variance of SOC stock snapshot to calculate sample sizes.

In most SOC projects, independent sampling is more practical and defensible. That’s why we typically recommend using the 1-sided independent-sample MDD test design. It tends to require higher sample sizes though, so practical considerations have to be balanced with budget constraints and project economics. 

If you're unsure about the use of paired- vs independent sampling and what they mean for your sample size and/or project economics, reach out to Seqana for advice.

Is the MDD approach to sample size always the best approach?

While 1-sided MDD-based t-tests are valuable for understanding the likelihood of detecting a positive change as statistically significant, they don’t always result in the most cost-effective sampling design.

That's where the Economic Optimum Number of Samples (EONS) approach comes in.

EONS helps you determine the number of samples that maximizes net revenue, by balancing:

  • Creditable revenue, which depends on your estimated SOC gains minus uncertainty deductions, and
  • Sampling costs, which grow with each additional sample.

Instead of aiming to detect a change with a statistical guarantee, EONS focuses on optimizing the financial return of your monitoring effort. This makes it especially useful in projects where maximizing net credits is more important than strict hypothesis testing. 

In practice, it can be helpful to cross-check both approaches

  • Use the MDD sample size calculator to understand how many samples you’d need to detect a positive change as statistically significant.
  • Use the EONS calculator to decide whether it’s worth the cost of additional samples to detect that a positive change is statistically significant.

Both tools are valuable, and they serve different but complementary purposes. 

Check out the EONS calculator here.

How do I figure out my Minimum Detectable Difference (MDD)?

To determine the MDD to use for sample size calculations for your project, you need to estimate your expected sequestration. The MDD should not be higher than the expected sequestration between the initial sampling and resampling event. 

The estimate of the expected sequestration is often based on historical or baseline sampling data, literature values for similar regions or soils, process based model results or pilot or stratified sampling efforts. It is important that the MDD is conservative, as estimating sequestration rates ex-ante are uncertain. Overly optimistic sequestration assumptions lead to choosing MDDs that are too high that lead to underestimating the required sample sizes. 

Need support?

Reach out to Seqana’s team for help with estimating variance, interpreting past data, or determining a realistic MDD for your project.

Still have questions about Sample Size Calculation with using the MDD?

Seqana can determine the ideal sample size using the MDD approach according to your project specifications.